W3BN Operations Bridge
Solar Indices
D-Layer Absorption
Live Absorption Forecast
HF Propagation
VHF/UHF Dynamics
Live MUF (MHz)
Greyline & Solar Map
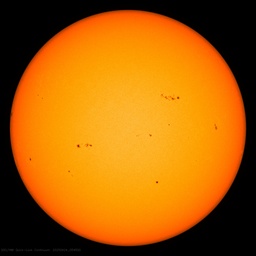
Sunspot Visual
Grid FN20 Status: Monitor the MUF Chart for 10m/6m openings. High D-Layer Absorption indicates elevated signal loss on 40m/80m during daylight hours.
Educational Briefing
Reference tutorial for decoding N0NBH indices. Jump to 01:50 for SFI explanation or 03:00 for K-Index stability notes.
Field Notes
-
SFI (Solar Flux)
Measures solar radio noise. Values >150 indicate excellent F-layer ionization for the high bands.
-
K-Index
Geomagnetic stability. Values under 4 are ideal; 5+ indicates a storm likely to degrade polar paths.
-
Night Propagation
D-Layer absorption disappears at night, making 40m-160m prime for long-distance DX.